👉 In the product Metrics > LCA > Dashboard view section (top right), you can view and compare data from tables or graphs. Thanks to these graphs and tables you can have a compilation of impacts of all your collection, segmented by stage, total, as well as equivalences and the benchmark. In case you want to see the information in a list, you can use the LCA list view.
An image says a thousand words…
In BCome, you can visualize useful and easy-to-read graphs to help you understand important company data, including those related to the individual references of your projects. You can view them by accessing your Article dashboard by clicking on the product photo when 👀 eyes appear.
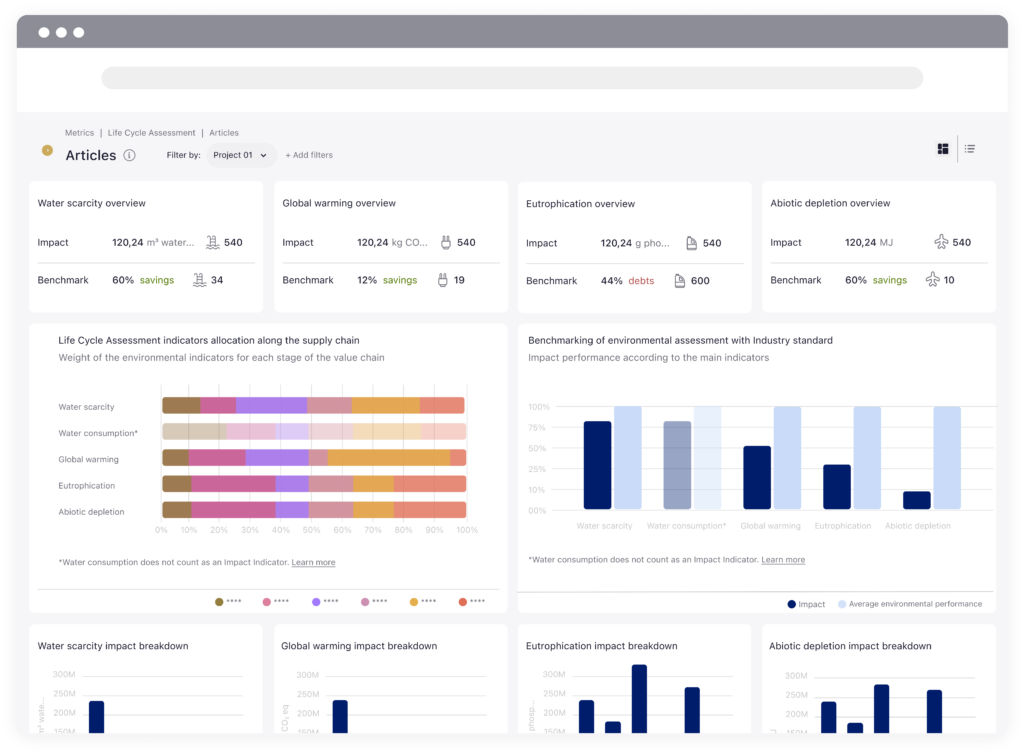
What information can I view?
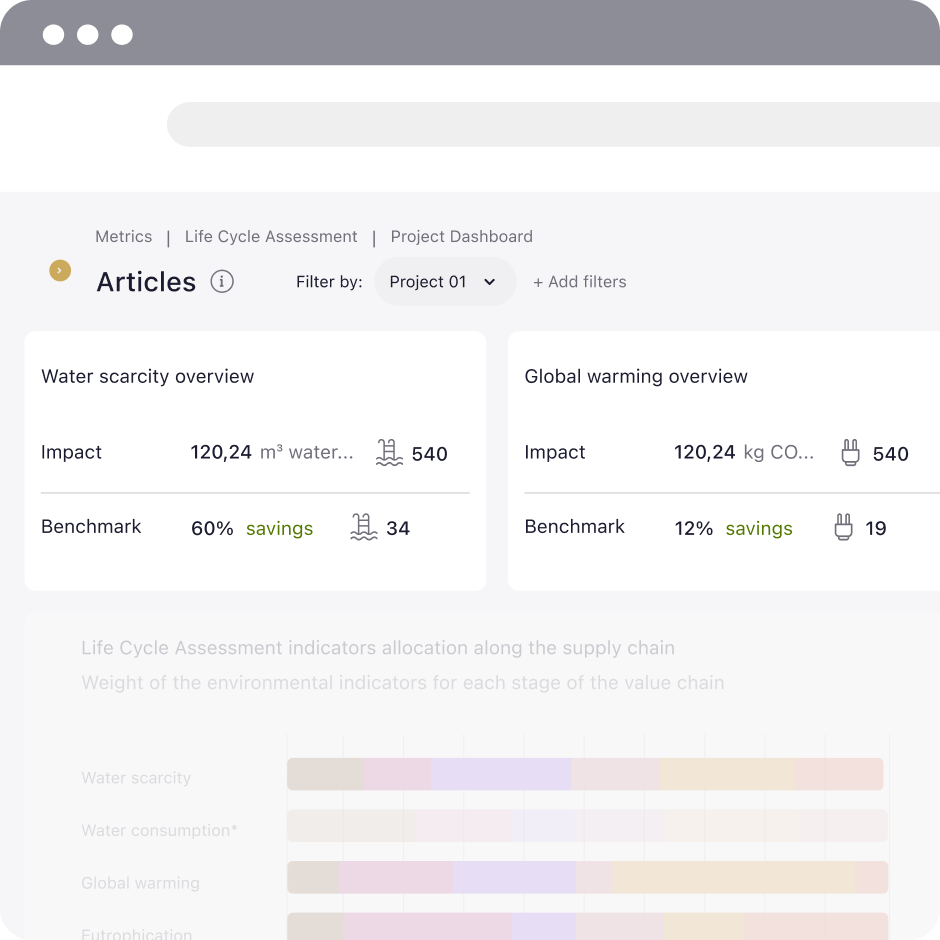
Project Life Cycle Assessment Impact & Benchmark Overview
The table summarizes:
- Impact: the total LCA impacts, considering the total amount of units of Articles produced within the project.
- Equivalence: the total LCA impact converted to user-friendly equivalences, considering the total amount of units of Articles produced within the project.
- Benchmark: the total LCA impact savings/debts, considering the total amount of units of Articles produced within the project.
- Equivalence: the total LCA impact savings/debts converted to user friendly equivalences, considering the total amount of units of Articles produced within the project.
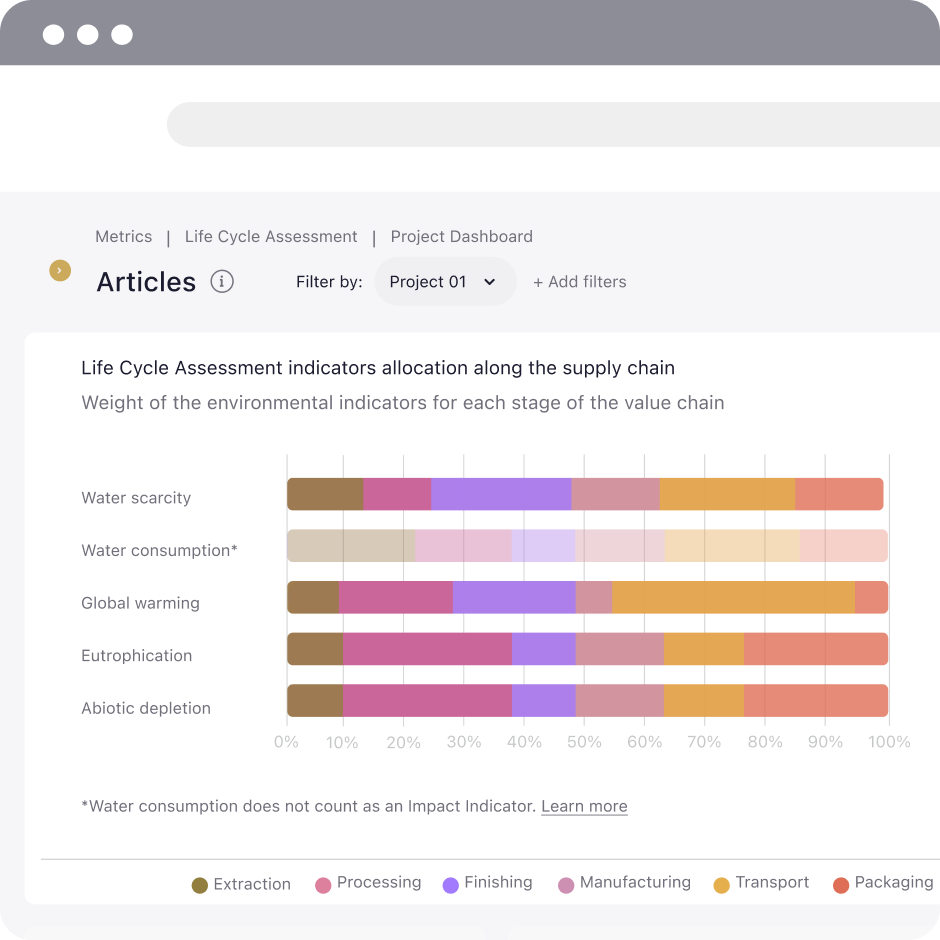
Environmental impact allocation along the supply chain
This graph shows the average environmental impact share (%) per stage of all the Articles included in the Project. Cradle-to-gate impacts are divided between raw material extraction, material processing, finishings, manufacturing, transport and packaging.
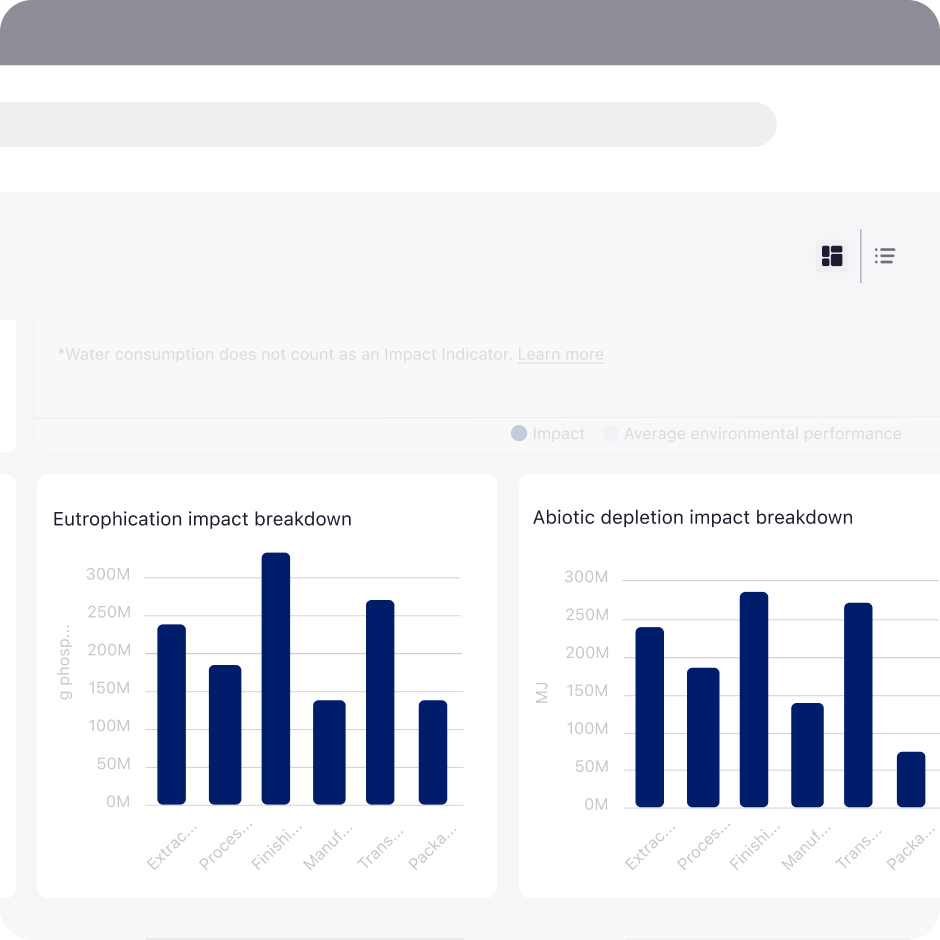
Indicator impact
- Water scarcity: this graph shows the average absolute water scarcity impact per stage of all the Articles included in the Project.
- Global warming: this graph shows the average absolute global warming impact per stage of all the Articles included in the Project.
- Eutrophication: this graph shows the average absolute eutrophication impact per stage of all the Articles included in the Project.
- Abiotic depletion: this graph shows the average absolute abiotic depletion impact per stage of all the Articles included in the Project.
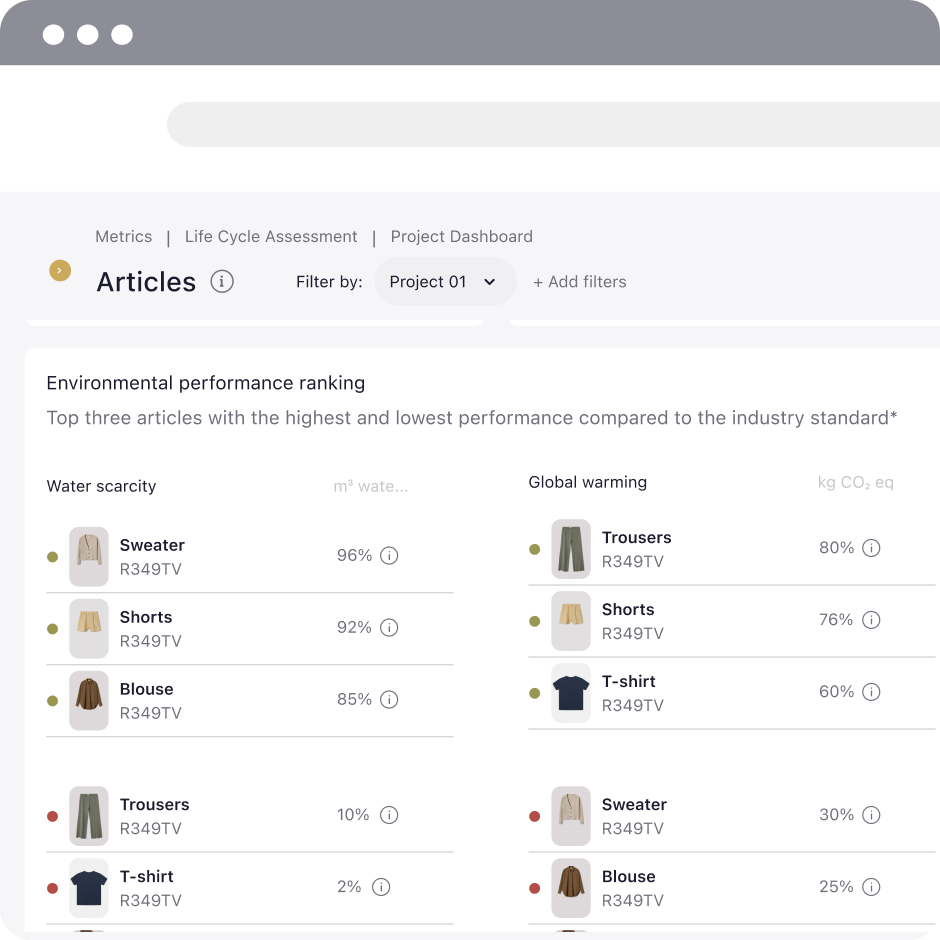
Environmental performance ranking
This module shows the difference of impact compared with the Industry standard defined in BCome methodology:
- The 3 best ranking articles in terms of savings of water scarcity, global warming, eutrophication and abiotic depletion in green.
- The 3 worst ranking articles in terms of savings or debts of water scarcity, global warming, eutrophication and abiotic depletion in red.
If you feel that some data is missing that would be valuable to you, please let us know and we will try to improve the dashboard for the future. Contact us at info@bcome.biz