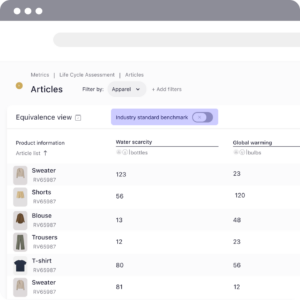
If you want to get specific LCA environmental impact indicators for each product and compare your performance with the Industry standard, you are in the best place. Here are some tips to better manage your impacts and make more effective decisions with our Life Cycle Assessment tool.
👉🏻 How do I access? From the sidebar, go to Metrics > LCA > LCA view (right side corner)
What is displayed on this view?
Assess the environmental impact of your items from start to finish, considering key environmental indicators and knowing the savings.
In this view you will see the environmental impacts both total and per stage of the following indicators:
- Water scarcity: Deprivation of water to humans and ecosystems due to water consumption in the product value chain.
- Global warming: Climate change caused by the greenhouse effect of heat-trapping pollutants released from the product value chain.
- Eutrophication: Proliferation of algae into an ecosystem due to the excess release of phosphates and nitrates in the product value chain.
- Abiotic depletion: Use of fossil fuels such as oil, natural gas and coal for the production of energy consumed in the value chain.

Do you want to know the savings of your products? The on/off toggle button 🔁 called Industry standard benchmark, at the top of the table header, will allow you to access it at any time. Find out what the LCA benchmark view can offer you

🤫 Secret: Each article has its own individual eye 👀 for quick access to the Article dashboard: where you will find a summary of the most important aspects. From there, search and compare with other articles and if you want. Download it to share with your team.
📖 If you have any negative results in your impacts, you can understand why in this post or, if you want to know more about the environmental indicators we offer you can access to Introduction to the BCome environmental indicators
What Preset views do I have?
Having trouble understanding the impact? Automatically you will see the Impact view but if you go to “Arrange Views” (table header on the left) you can transform the impact into equivalencies that will make your impact more tangible.
🤫 Secret: If you are in the Communication department, this information will help you to better communicate your impacts to your consumers.


How can I edit and customize my tables?
We provide you with a series of actions to make the tables more yours according to your needs and tastes of the moment.
- How to customize your views
- How to toggle columns
- How to narrow down with filters
- How to download and share your results
Learn by role
- Are you from the Comms or MK Department? Equivalences will be your best allies.
- Are you from the IT department? Downloading the excel file will make it easier to load the impacts on your ecommerce.
- Are you from the Product or Sustainability department? By filtering and editing the columns you will be able to know your best articles.